33 Life expectancy
Life expectancy is the average number of years a person is expected to live. It is a crucial indicator of the quality of living and one of the three components of the Human Development Index (HDI) (the other two components are education and per capita GDP). Here is a toy example to compute life expectancy with hypothetical data.1
To simplify our analysis, we will assume there are only five possible ages: 0, 20, 40, 60, and 80. A baby is born at age 0, and can either die at that age or survive to age 20. We intentionally exclude intermediate ages such as 5 and 10 for the sake of computational simplicity.
It’s important to note that life expectancy is not the same as the average age of the population. For instance, based on the hypothetical data presented, the average age can be calculated as: \[\overline{\textrm{Age}}=(0\times200+20\times300+40\times250+60\times150+80\times100)/1000=33.\]
However, the expected age, denoted as \(E(\textrm{Age})\), is defined as: \[E(\textrm{Age})=\sum\textrm{Age}\times P(\textrm{Age}).\]
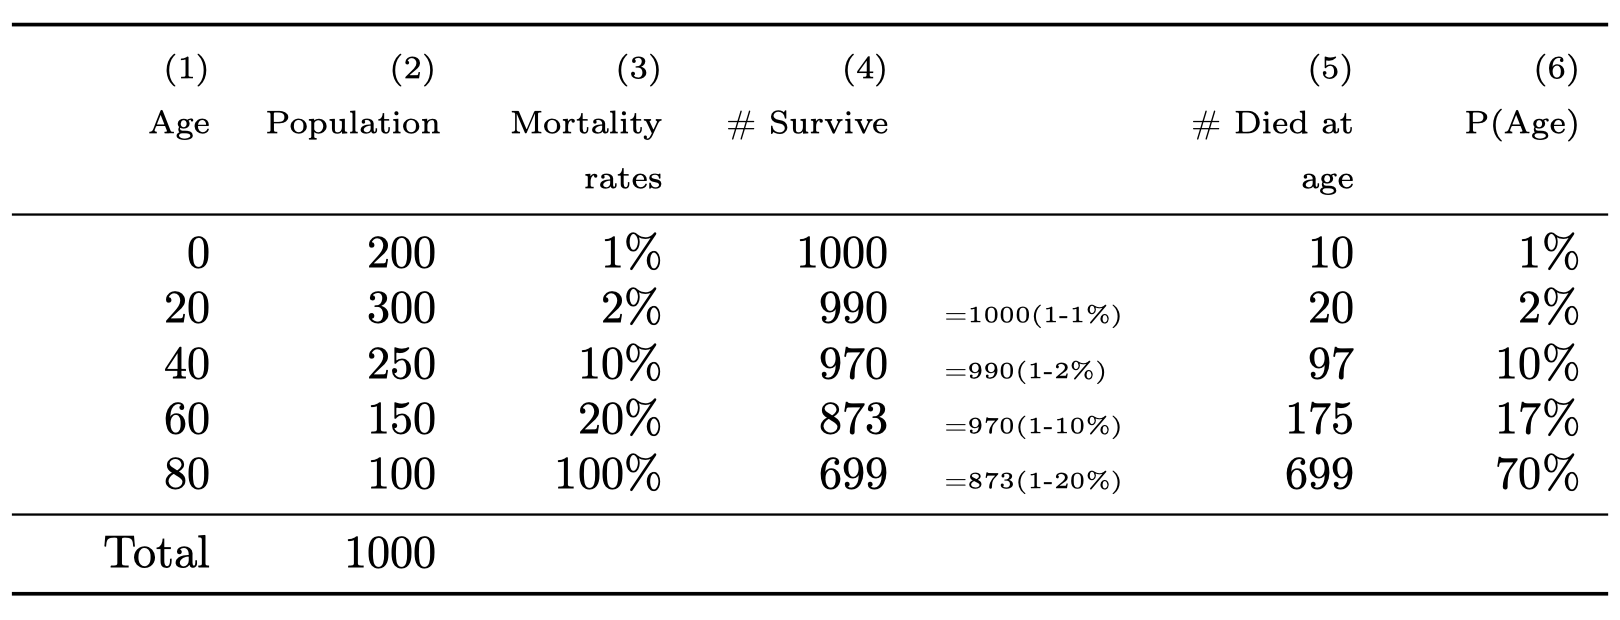
To compute this expected value, we need to determine \(P(\textrm{Age})\), the probability of living to a specific age or dying at that age. This requires consideration of the mortality rate at each age, which is given in Column 3.
Assuming 1000 babies are born at age 0, with a mortality rate of 1% at that age, we find that 99% of the babies survive to age 20. Thus, the number of babies that survive to age 20 is: \(1000\times(1-1\%)=990\). We can apply similar calculations to determine the number of survivors at each subsequent age.
The number of individuals who die at a specific age (Column 5) is the difference between the number of survivors at that age and the next (Column 4). To find the probability of living to a specific age, we compute: \(P(\textrm{Age})=\textrm{Column 4}/1000\).
Finally, we compute the expected value of age (or life expectancy) as follows: \[E(Age)=0\times1\%+20\times2\%+40\times10\%+60\times17\%+80\times70\%=70.6.\] This figure differs from the average age. Since the mortality rate is low at younger ages, the probabilities \(P(\textrm{Age})\) for these ages are also low, while they are higher for older ages. This example illustrates the distinction between average and expected values. In everyday conversation, we may use these terms interchangeably, but in certain contexts, expected values can significantly differ from averages.
This is an overly simplified example that only serves to clarify the definition of expectation. See this tutorial from MEASURE Evaluation for the actual computation of life expectancy.↩︎